matlab分析频率响应

matlab如何分析滤波器的频率响应呢? 可以用freqz函数。 matlab的说明文档中的描述如下:

h = freqz(b,a,w) returns the frequency response vector h calculated at the frequencies (in radians per sample) supplied by the vector w. The vector w can have any length.

举个例子, 比如下面的滤波器:

$X( e^{j\omega} ) =\frac{0.008-0.033e^{-j\omega} + 0.05e^{-j2\omega} - 0.0333e^{-j3\omega}+0.008e^{-j4\omega}} {1+2.37e^{-j\omega}+2.7e^{-j2\omega}+1.6e^{-j3\omega}+0.41e^{-j4\omega}}$

b——-分子的系数,以向量的形式输入;a分母的系数,以向量的形式输入 :

matlab的代码如下:

1
2
3
4
5
6
7
8
9
10
11
12
13
14
15
16
17
18
19
20
21
22
23
24
k = input('Number of frequency points = ');
% Read in the numerator and denominator coefficients
num = input('Numerator coefficients = ');
den = input('Denominator coefficients = ');
% Compute the frequency response
w = 0:pi/(k-1):pi;
h = freqz(num, den, w);
% Plot the frequency response
subplot(2,2,1)
plot(w/pi,real(h));grid
title('Real part')
xlabel('\omega/\pi'); ylabel('Amplitude')
subplot(2,2,2)
plot(w/pi,imag(h));grid
title('Imaginary part')
xlabel('\omega/\pi'); ylabel('Amplitude')
subplot(2,2,3)
plot(w/pi,abs(h));grid
title('Magnitude Spectrum')
xlabel('\omega/\pi'); ylabel('Magnitude')
subplot(2,2,4)
plot(w/pi,angle(h));grid
title('Phase Spectrum')
xlabel('\omega/\pi'); ylabel('Phase, radians')

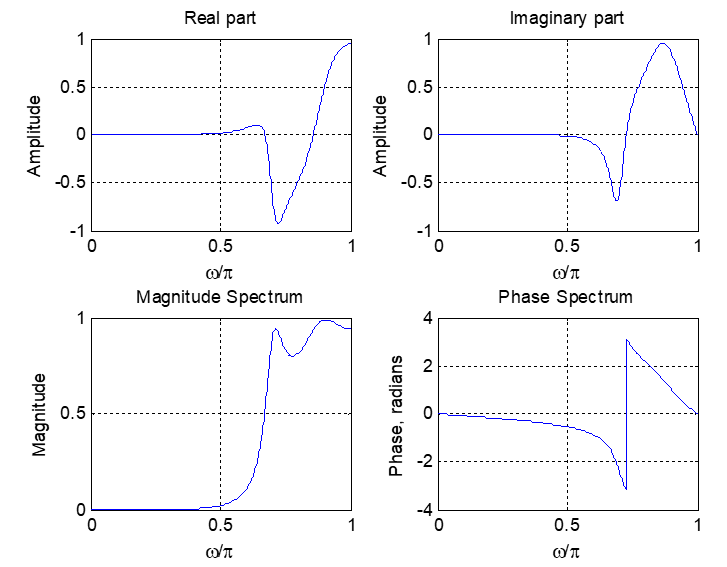
那么可以画出幅频响应和相频响应如下图所示: